Hundreds of events to choose from
We work with running, cycling and triathlon events. Together we choose where to measure, by discipline, area and target.
Brand Hunter
From race photos we find out which shoes and bikes athletes really use, and who chooses them. We use Gen AI from Huware, our technology partner, to deliver a report in 48 hours.
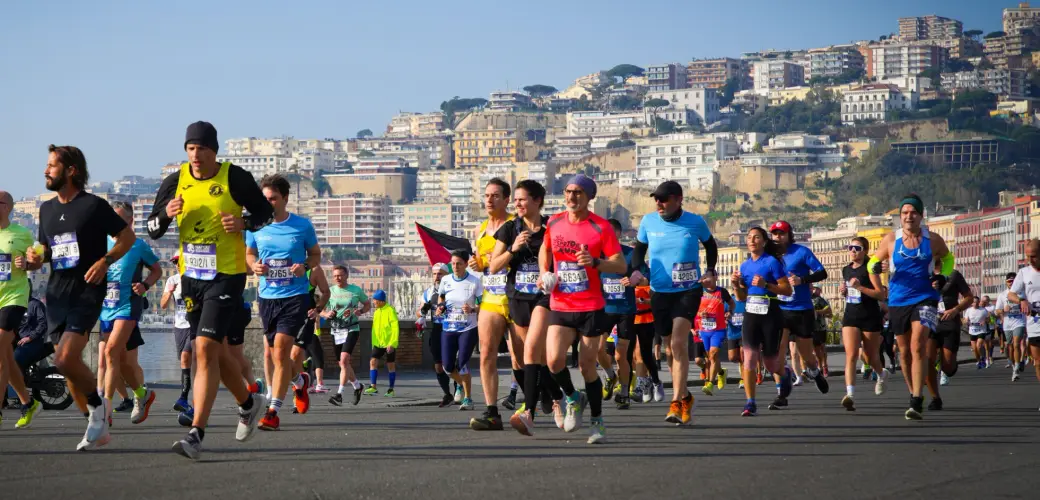
Brand Hunter works on ENDU events and uses race data no other tool can cross-reference.
We work with running, cycling and triathlon events. Together we choose where to measure, by discipline, area and target.
We cross-reference the brands we detect with registration data and official results, always in aggregated form.
Simulated figures for an Italian half marathon.
Simple dedicated photo stations at key points of the course are all it takes, with no impact on the race.
15,200photos in 2 hoursThe AI isolates every shoe in every shot and recognizes its brand.
52,400shoe crops analyzedFigures by brand, ready in 48 hours.
6,240participants sampledThe figures below are not real. They simulate the analysis of an Italian half marathon.
age range 18-76
share among all participants and the top 100 finishers
share of the top brands, same event one year apart
share of women in each half-hour slot at the photo station
Who your target is and where it is concentrated, based on real product use.
Who leads the market and who is chasing, race after race.
Which brand wins in which segment, by gender and age.
Which brands retain athletes and which lose them, season after season.
Which brands top runners choose, based on finish times.
Brand Hunter covers the main endurance disciplines, at big and small events: marathons, gran fondos, park runs and community rides.
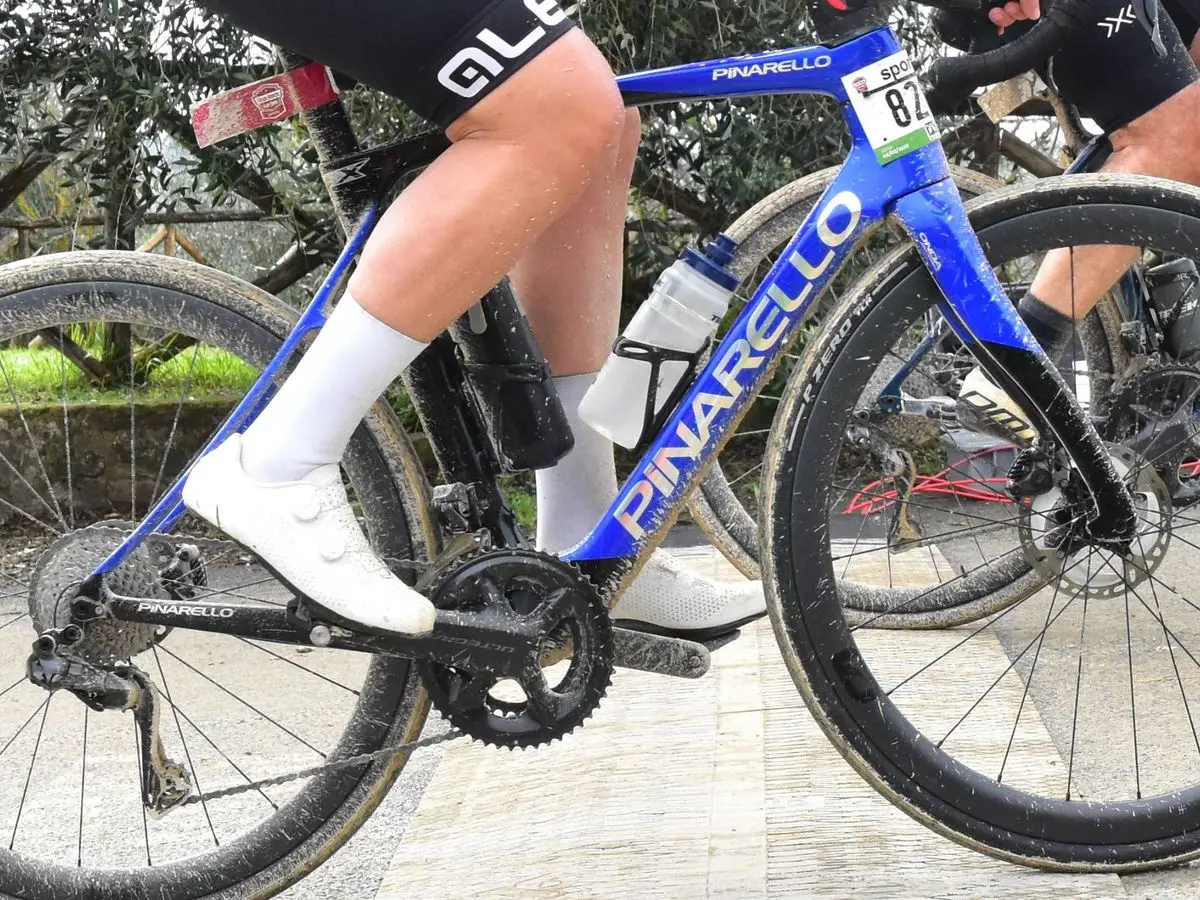
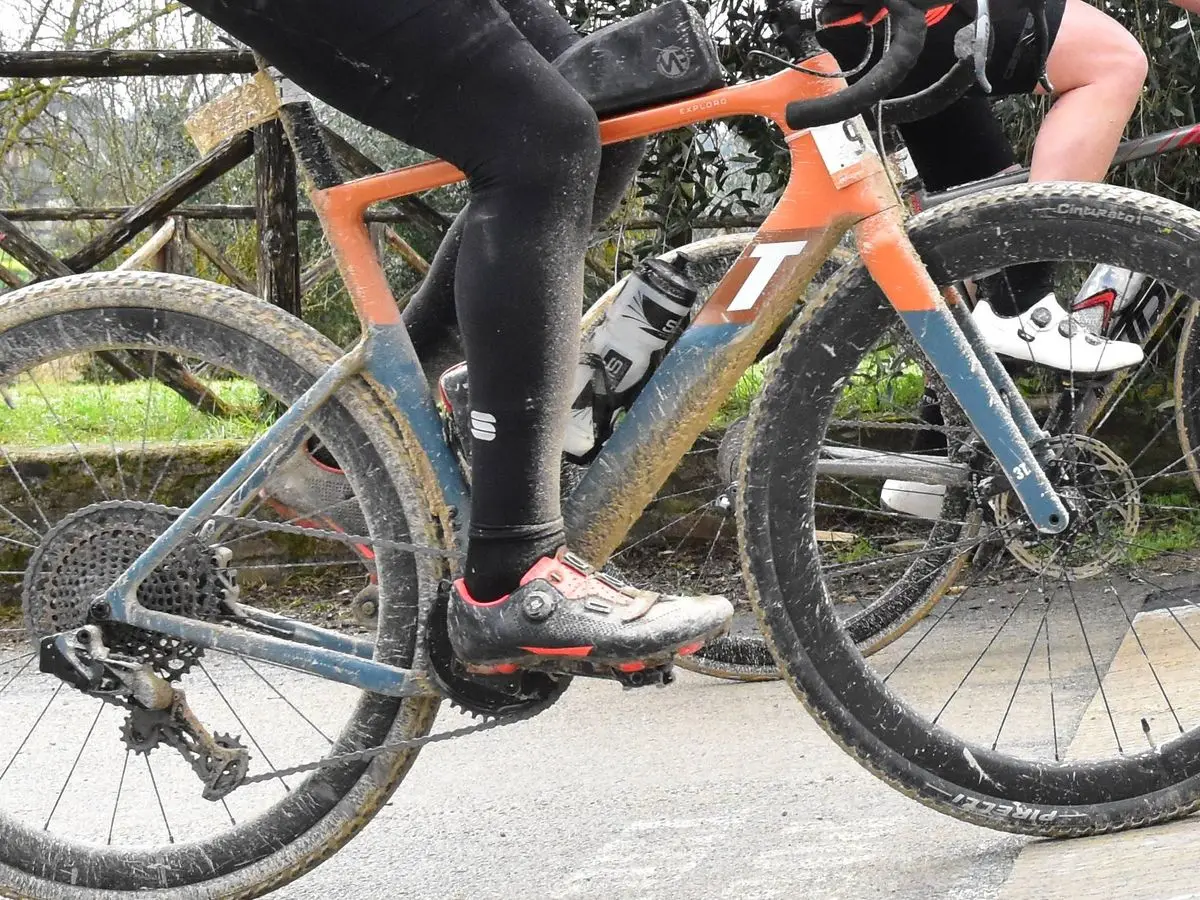
What the AI sees, and what reaches the brand.
The AI recognizes products, not faces. Registrations and results are matched inside ENDU.
Gender, age, home region and times are shared only in aggregated, anonymous form.
Registrations and results feed the analysis only in aggregate. The brand never receives personal data.
Tell us what you need, from brand presence to athlete statistics, and we'll show you what Brand Hunter can measure.